How to analyse excitons - ICTP 2022 school
In this tutorial you will learn how to:
- analyze an optical spectrum obtained from BSE in terms of excitonic energies and composition
- look at the spatial distribution of the exciton
This is demonstrated for 3D hBN, for which you should have obtained the needed data from previous calculations.
Warning: for this demonstration, we did not use converged parameters (in particular they are not converged for the k-grid). Note that one needs to converge carefully all parameters to obtain scientific relevant results. This will be the topic of one of the next tutorials.
Prerequisites
Previous modules
- You must have completed the Calculating optical spectra including excitonic effects: a step-by-step guide tutorial.
You will need:
- The
SAVEdatabases for 3D hBN - The
3D_BSEdirectory containing thendb.BS_diago*databases for 3D hBN yppexecutablexcrysdenorVESTAexecutablesgnuplotexecutable
All the databases required for this tutorial should be in the YAMBO_TUTORIALS/hBN/ directory.
List the excitonic energies
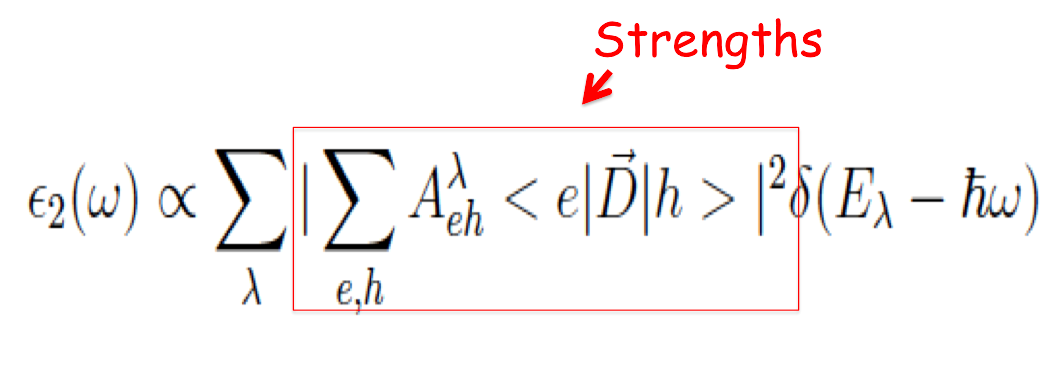
First, we will obtain the list of all the exciton energies (that is the eigenvalues of the two-particle Hamiltonian) sorted both by energy and strength. The exciton strengths or intensities are defined from the expression of the optical absorption spectrum as
That is, they are given by the linear combination of the square of the dipole transition matrix elements between electron-hole pairs, where Aλeh is the exciton composition in terms of electron-hole pairs.
To read this information from the Yambo databases produced in this previous step, we use the Yambo pre- and post-processing utility ypp.
Type:
$ ypp -J 3D_BSE -e s 1
This instructs the code to list the excitons (-e s) in the database 3D_BSE (-J 3D_BSE) for the q-index = 1 (optical limit q=0).
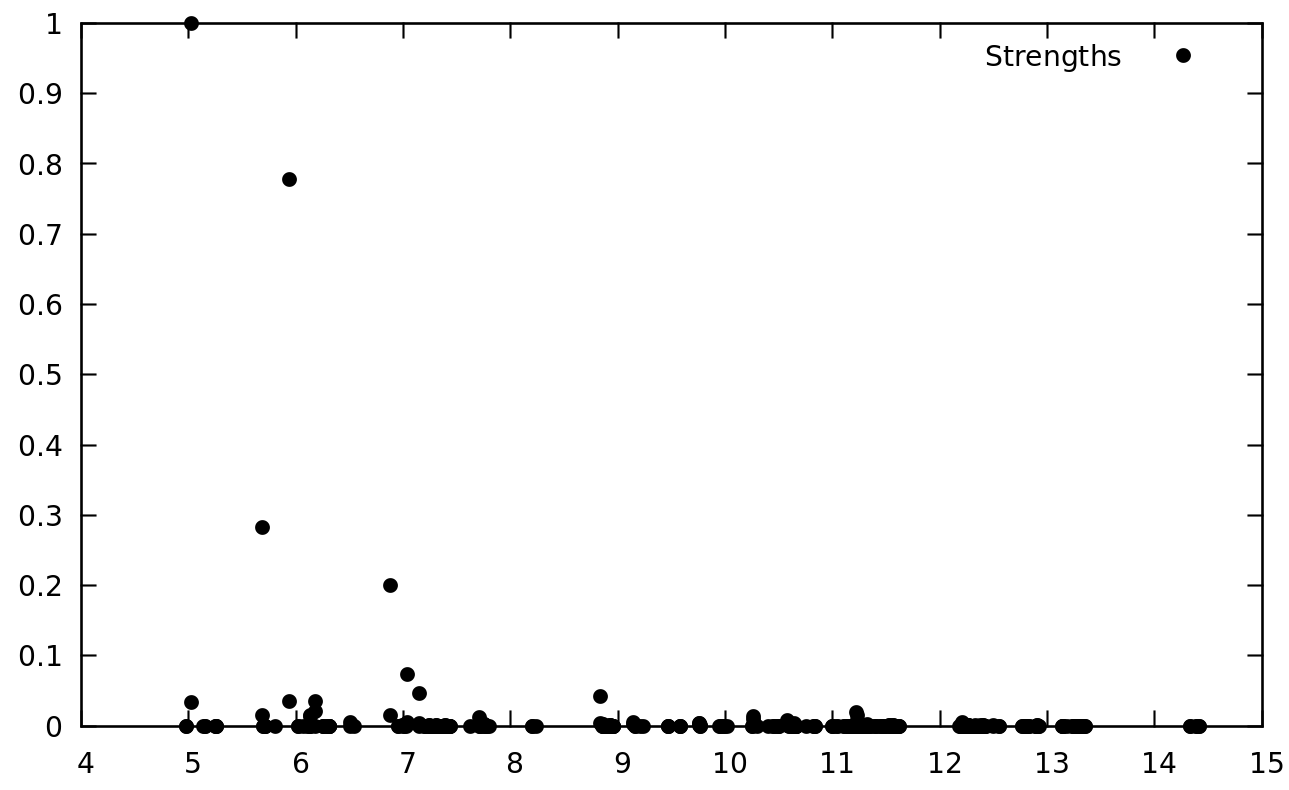
The results are output in the files o-3D_BSE.exc_qpt1_E_sorted and o-3D_BSE.exc_qpt1_I_sorted. They report the energies of the excitons and their strengths. The strengths are normalised to the largest strength. Thus in the list, the brightest exciton has strength 1. In o-3D_BSE.exc_qpt1_E_sorted the exciton energies are sorted by energy (lower to higher), in o-3D_BSE.exc_qpt1_I_sorted by the oscillator strength (larger to smaller).
Inspect o-3D_BSE.exc_qpt1_E_sorted:
The exciton with the lowest energy (3.54 eV) is doubly degenerate. The strength is ~0, thus this exciton is dark, does not contribute to the absorption spectrum.
The second-lowest exciton is also doubly degenerate and it is the brightest (one of the components has strength 1, the other ~0.5). The latter exciton is the one responsible for the largest peak in the optical absorption plots of the previous tutorials.
To better visualize these results, we plot the exciton strength (normalized to 1, arbitrary units) versus the energy (in eV):
$ gnuplot
gnuplot> set style line 2 lc rgb 'black' pt 7   # circle
gnuplot> plot 'o-3D_BSE.exc_qpt1_E_sorted' with points ls 2 title 'Strengths'
Calculate the exciton oscillator strength and amplitude
Once inspected the list of excitons sorted by energies and strengths, we will look at the composition of some of these excitons in terms of single-particle states (electron-hole pairs).
Type:
$ ypp -F ypp_AMPL.in -J 3D_BSE -e a 1
This instructs the code to create the the input file ypp_AMPL.in (-F ypp_AMPL.in) to analyze the composition of the excitons (-e a) in the database 3D_BSE (-J 3D_BSE) for the q-index = 1 (optical limit q=0).
You can now edit the input file ypp_AMPL.in. From the list of excitons, we should have got an idea of which excitons we wish to analyze. The ordering from the list of exciton sorted by energies in o-3D_BSE.exc_qpt1_E_sorted is used to identify the excitons to analyse.
For example, to analyse the 4 lowest-energy excitons (i.e., the first 2 doubly-degenerate excitons of which the first is dark and the second is bright) change this line as:
States= "1 - 4" # Index of the BS state(s)
Close the input file and run ypp again by typing
$ ypp -F ypp_AMPL.in -J 3D_BSE
This carries out the analysis for the specified excitons. The results are output in o-3D_BSE.exc_qpt1_amplitude_at_* and o-3D_BSE.exc_qpt1_weights_at_*, where * identifies the exciton according to the order in o-3D_BSE.exc_qpt1_E_sorted.
$ ls  o*exc*at*
o-3D_BSE.exc_qpt1_amplitude_at_1 o-3D_BSE.exc_qpt1_weights_at_1 ...
For an exciton [math]\displaystyle{ |\lambda\gt }[/math] , o-3D_BSE.exc_qpt1_weights_at_* reports the weights defined as
and o-3D_BSE.exc_qpt1_amplitude_* reports the amplitudes defined as
Inspect, for example, the file o-3D_BSE.exc_weights_at_3 (which we learned from o-3D_BSE.exc_qpt1_E_sorted has the largest strength)
# Band_V          Band_C          Kv-q ibz        Symm_kv         Kc ibz          Symm_kc         Weight          Energy
#
  7.00000000      10.0000000      14.0000000      2.00000000      14.0000000      2.00000000     0.395135850      4.35248947
  7.00000000      10.0000000      14.0000000      1.00000000      14.0000000      1.00000000     0.394993663      4.35248947
  8.00000000      9.00000000      14.0000000      2.00000000      14.0000000      2.00000000     0.391943455      4.35241365
  8.00000000      9.00000000      14.0000000      1.00000000      14.0000000      1.00000000     0.391800284      4.35241365
  7.00000000      10.0000000      13.0000000      2.00000000      13.0000000      2.00000000     0.745555162E-1   4.81094742
  7.00000000      10.0000000      13.0000000      1.00000000      13.0000000      1.00000000     0.745274872E-1   4.81094742
  8.00000000      9.00000000      13.0000000      2.00000000      13.0000000      2.00000000     0.739243180E-1   4.81087065
  8.00000000      9.00000000      13.0000000      1.00000000      13.0000000      1.00000000     0.738964081E-1   4.81087065
The third exciton is mostly composed of single-particle transitions from VBM to CBM at point H (last k-point of the grid, number 14) of the 3D hexagonal Brillouin zone, with contributions also coming from point K (number 13). All the contributions weighing less than 5% are not shown by default.
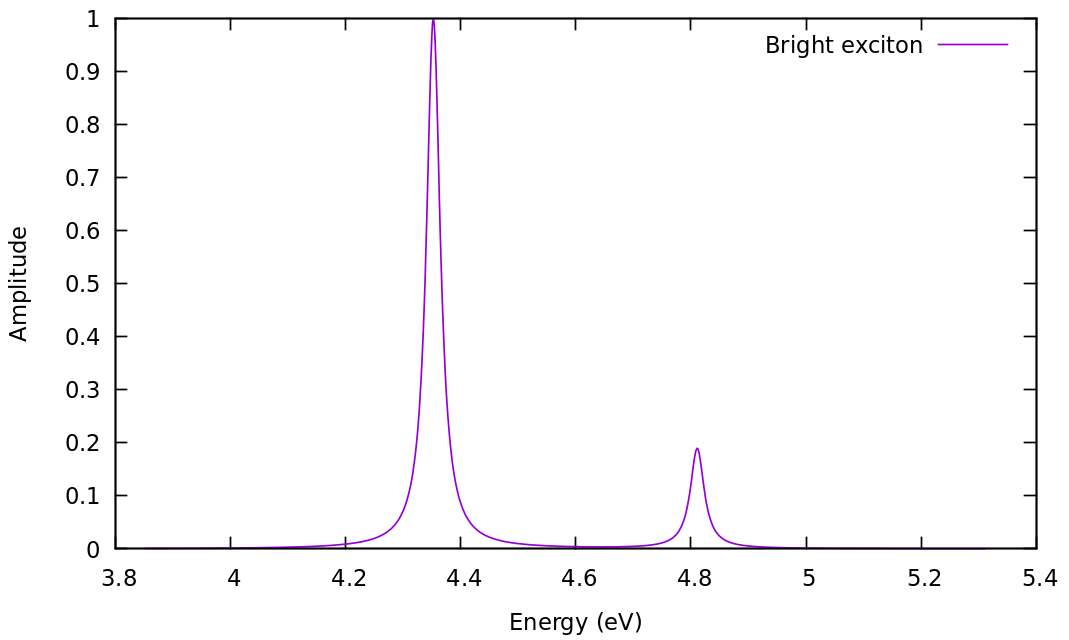
Recall from the previous analysis that of the first 4 exciton states, exciton states 3 and 4 (degenerate) are the optically active ones. We plot then the amplitude of the lowest energy bright exciton:
$ paste o-3D_BSE.exc_qpt1_amplitude_at_3 o-3D_BSE.exc_qpt1_amplitude_at_4 > o-3D_BSE.exc_qpt1_amplitude_at_3_4
$ gnuplot
gnuplot> set xlabel 'Energy (eV)'
gnuplot> set ylabel 'Amplitude'
gnuplot> p 'o-3D_BSE.exc_qpt1_amplitude_at_3_4' u 1:($2+$4)/2 w l t 'Bright exciton'
Note that while this plot is related to the peaks in the optical absorption spectrum, it lacks the coupling with the external field, which is encoded in the dipole matrix elements.
Plot the exciton spatial distribution
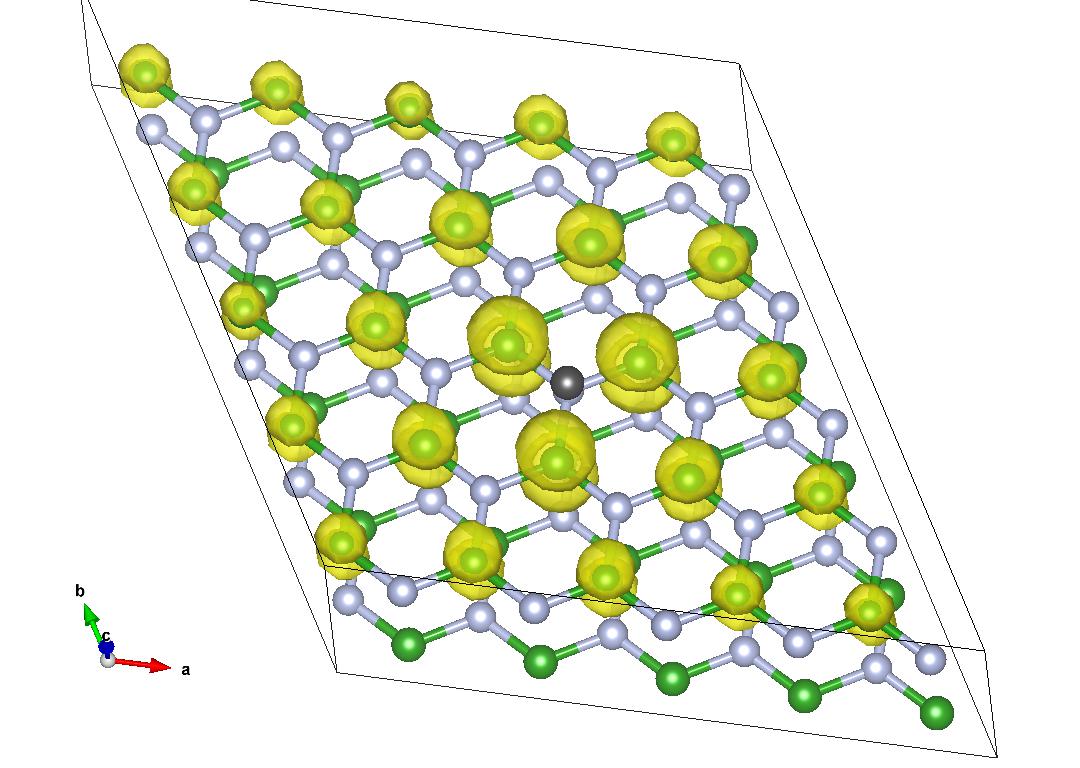
A further analysis we carry out is on the spatial distribution of the exciton, specifically of the probability of finding the electron at a certain position r when the hole is fixed in a position r'.
Create the input file ``ypp_WF.in`` using the command below and change the various parameters as shown below:
$ ypp -F ypp_WF.in -J 3D_BSE -e w
excitons                     # [R] Excitons
wavefunction                 # [R] Wavefunction
Format= "x"                  # Output format [(c)ube/(g)nuplot/(x)crysden]
Direction= "123"               # [rlu] [1/2/3] for 1d or [12/13/23] for 2d [123] for 3D
FFTGvecs=  30        Ry    # [FFT] Plane-waves
States= "3 - 3"              # Index of the BS state(s)
Degen_Step=   0.0100   eV    # Maximum energy separation of two degenerate states
% Cells
 5 | 5 | 1 |                             # Number of cell repetitions in each direction (odd or 1)
%
% Hole
2.35800028 | 1.36139178 | 7.08835602 # [cc] Hole position in unit cell (positive)
%
Cells, is the size of the cell where the exciton will be visualised.
If the k-grid used for the BSE calculations is XxYxZ, then the exciton has an induced fictitious periodicity for every XxYxZ cells of the simulation.
For hBN, this is not a problem because the first bright exciton is strongly localized, but in other systems, where excitons are more delocalized, one must use very large k-grids for the BSE calculation.
Degen_Step, tells the maximum energy separation of two degenerate states. Since this value is small enough, the code will automatically recognize excitons 3 and 4 are degenerate and merge them: you can check this in the log file.
Plots can be in 1, 2 or 3D (Direction) and the output format is chosen with Format.
A non-trivial input parameter is the hole position. The best position for the hole is where the valence electrons contributing to the exciton are localised. In the case of hBN, they are on the nitrogen atoms. We can obtain the Cartesian coordinates of these atoms from our previously generated o-3D_BSE.exc_qpt1_E_sorted file:
# Atom 1 with Z 5 [cc]:  2.35800028      1.36139178      0.00000000
# Atom 2 with Z 5 [cc]: -2.35800028     -1.36139178      6.08835602
# Atom 1 with Z 7 [cc]: -2.35800028     -1.36139178      0.00000000
# Atom 2 with Z 7 [cc]:  2.35800028      1.36139178      6.08835602
We take the positive values of the nitrogen (Z=7, last line) and shift the vertical position of the hole from 6.088 to 7.088 so that the hole does not end up in the center of the atom (and therefore, possibly in a node of the wave function).
Close the input file and run ypp by typing
$ ypp -F ypp_WF.in -J 3D_BSE
After the calculation is completed, we can visualise the output with xcrysden or with VESTA:
$ xcrysden --xsf o-3D_BSE.exc_qpt1_3d_3.xsf
$ VESTA o-3D_BSE.exc_qpt1_3d_3.xsf
We notice that the electron is completely confined on the boron atoms and on the same layer of the hole. For comparison, see for example ref. [1].
Plot electron/hole average density (only in Yambo 5.x)
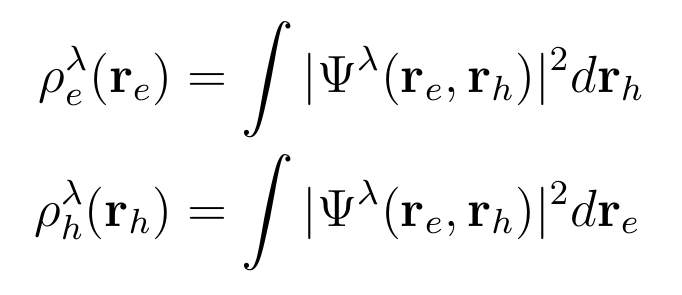
Another way to analyze the spatial character of excitons is to plot the average electron/hole densities defined as:
To generate the input file ypp_WF.in type
ypp -F ypp_WF.in -e w -avehole
and choose the exciton you want to plot according to the list of energy-sorted excitons. The electron/hole average densities correspond to generalized valence/conduction orbitals for a given exciton. They are interesting in particular for molecular crystals because they allow distinguishing charge-transfer versus Frenkel excitons, from the relative position of the electron/hole densities.
If you want to see an example of hole/electron density of excitons please have a look at Ref. [2].
Summary
From this tutorial you've learned:
- How sort excitonic states by energy and intensity
- Analyse their composition in reciprocal space and in terms of single-particle transitions
- Visualize the exciton wave function in real space
References
- ↑ Huge Excitonic Effects in Layered Hexagonal Boron Nitride, B. Arnaud et al., preprint ArXiv
- ↑ Strongly Bound Excitons in Metal-Organic Framework MOF-5: A Many-Body Perturbation Theory Study, A. R. Kshirsagar et al., preprint ChemRxiv
- Calculating optical spectra including excitonic effects: a step-by-step guide tutorial
- Back to CECAM 2021 tutorial page for the BSE
- Back to tutorials menu
- Back to technical modules menu
- Similar tutorial for 2D-hBN and including finite-momentum BSE: this page.
