Local fields: Difference between revisions
No edit summary |
No edit summary |
||
| Line 20: | Line 20: | ||
$ yambo -F yambo.in_RPA -V RL -J q100 -o c -k hartree | $ yambo -F yambo.in_RPA -V RL -J q100 -o c -k hartree | ||
and make sure to set/modify all of the following variables to: | and make sure to set/modify all of the following variables to: | ||
FFTGvecs= ''6 Ry'' # [FFT] Plane-waves | FFTGvecs= '''6 Ry''' # [FFT] Plane-waves | ||
Chimod= "Hartree" # [X] IP/Hartree/ALDA/LRC/BSfxc | Chimod= "Hartree" # [X] IP/Hartree/ALDA/LRC/BSfxc | ||
NGsBlkXd= ''3 Ry'' # [Xd] Response block size | NGsBlkXd= '''3 Ry''' # [Xd] Response block size | ||
% QpntsRXd | % QpntsRXd | ||
1 | 1 | # [Xd] Transferred momenta | 1 | 1 | # [Xd] Transferred momenta | ||
| Line 48: | Line 48: | ||
$ gnuplot | $ gnuplot | ||
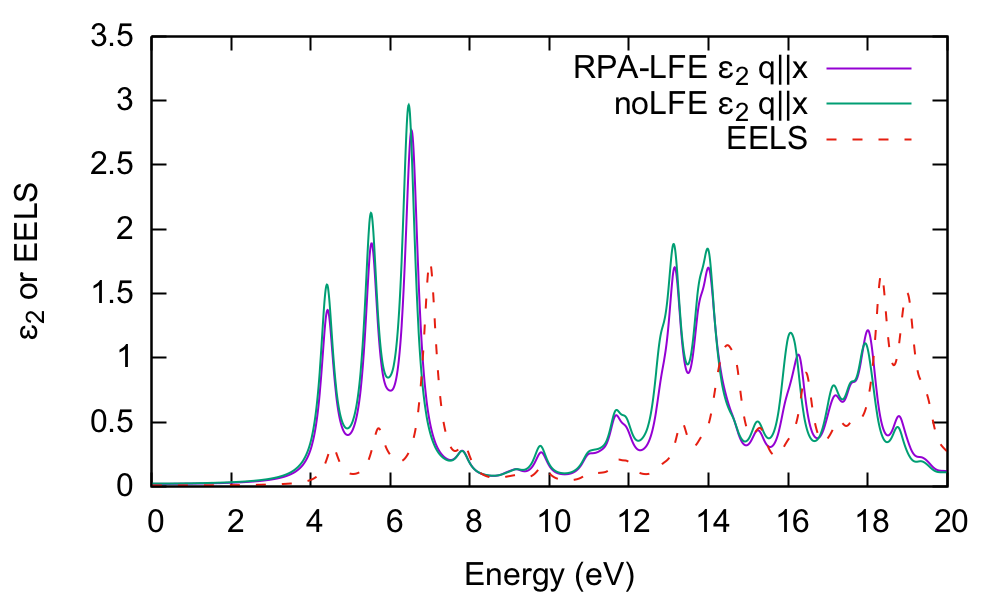
gnuplot > plot "o-q100.eps_q1_inv_rpa_dyson" u 1:2 t "q||x RPA-LFE" w l,"o-q100.eps_q1_inv_rpa_dyson" u 1:4 t "q||x noLFE" w l | gnuplot > plot "o-q100.eps_q1_inv_rpa_dyson" u 1:2 t "q||x RPA-LFE" w l,"o-q100.eps_q1_inv_rpa_dyson" u 1:4 t "q||x noLFE" w l | ||
[[File:CH-LFE4.png|none|600px|Yambo tutorial image]] | |||
It is clear that there is little influence of local fields in this case. We have also plotted the EELS spectrum for comparison. | It is clear that there is little influence of local fields in this case. We have also plotted the EELS spectrum for comparison. | ||
Now let's switch to ''q'' perpendicular to the BN plane: | Now let's switch to ''q'' perpendicular to the BN plane: | ||
$ yambo -F yambo.in_RPA -V RL -J ''q001'' -o c -k hartree ''and set'' | $ yambo -F yambo.in_RPA -V RL -J '''q001''' -o c -k hartree ''and set'' | ||
... | |||
% LongDrXd | % LongDrXd | ||
0.000000 | 0.000000 | ''1.000000'' | # [Xd] [cc] Electric Field | 0.000000 | 0.000000 | ''1.000000'' | # [Xd] [cc] Electric Field | ||
% | % | ||
... | |||
$ yambo -F yambo.in_RPA -V RL -J ''q001'' | $ yambo -F yambo.in_RPA -V RL -J ''q001'' | ||
Plotting the output file: | |||
$ gnuplot | |||
gnuplot> plot "o-q001.eps_q1_inv_rpa_dyson" u 1:2 t "RPA-LFE {/Symbol e}_2 q||z" w l,"o-q001.eps_q1_inv_rpa_dyson" u 1:4 t "noLFE {/Symbol e}_2 q||z" w l | |||
[[File:CH-LFE4.png|none|600px|Yambo tutorial image]] | |||
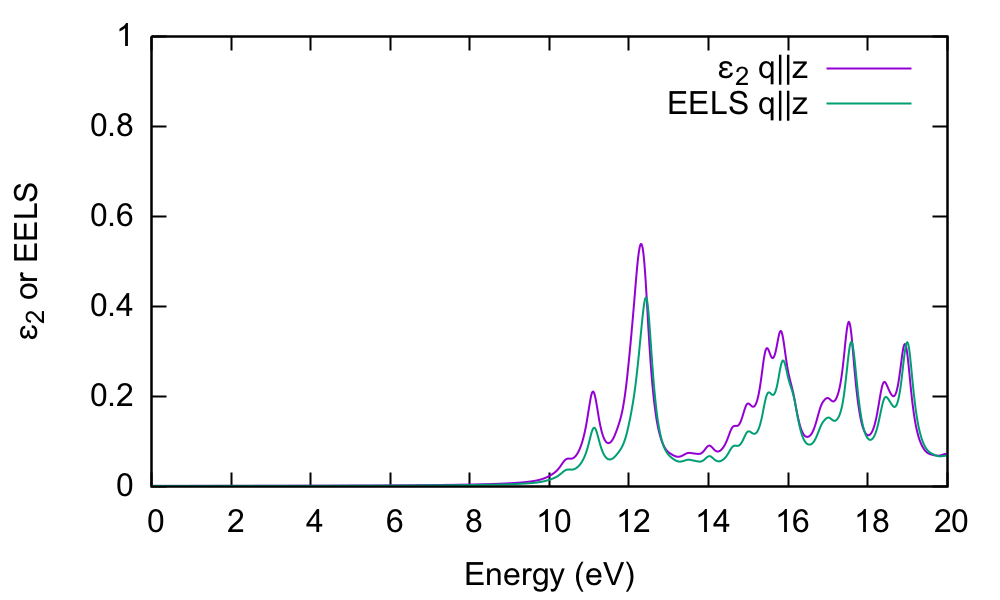
In this case, the absorption is strongly blueshifted. Furthermore, the influence of local fields is striking, and quenches the spectrum strongly. | In this case, the absorption is strongly blueshifted. Furthermore, the influence of local fields is striking, and quenches the spectrum strongly. | ||
| Line 62: | Line 68: | ||
$ gnuplot | $ gnuplot | ||
gnuplot > plot "o-q001.eps_q1_inv_rpa_dyson" u 1:2 t "q||z {/Symbol e}_2" w l,"o-q001.eel_q1_inv_rpa_dyson" u 1:2 t "q||z EELS" w l | gnuplot > plot "o-q001.eps_q1_inv_rpa_dyson" u 1:2 t "q||z {/Symbol e}_2" w l,"o-q001.eel_q1_inv_rpa_dyson" u 1:2 t "q||z EELS" w l | ||
[[File:CH-LFE5.png|none|600px|Yambo tutorial image]] | |||
The conclusion is that the dielectric function and EELS coincide for isolated systems, while this is not the case for periodic systems. | The conclusion is that the dielectric function and EELS coincide for isolated systems, while this is not the case for periodic systems. | ||
Revision as of 15:06, 29 March 2017
In this tutorial you will learn how to calculate the macroscopic dielectric function for bulk hBN (i.e. including local field effects- LFE) by solving the Dyson equation for X:
The microscopic dielectric function is related to X by:
and the macroscopic dielectric function is obtained by taking the (0,0) component of the inverse microscopic one:
Here we will use the RPA level: thus f xc=0 in the above (Hartree kernel).
Prerequisites
- You must first complete the "How to use Yambo" tutorial
You will need:
- The
SAVEdatabases for 2D hBN - The
yamboexecutable gnuplot, for plotting spectra
Choosing input parameters
Enter the folder for 2D hBN that contains the SAVE directory, and generate the input file. From yambo -H you should understand that the correct option is yambo -o c -k hartree. Let's start by running the calculation for light polarization q in the plane of the BN sheet:
$ cd YAMBO_TUTORIALS/hBN-2D/YAMBO
$ yambo -F yambo.in_RPA -V RL -J q100 -o c -k hartree
and make sure to set/modify all of the following variables to:
FFTGvecs=     6        Ry    # [FFT] Plane-waves
Chimod= "Hartree"            # [X] IP/Hartree/ALDA/LRC/BSfxc
NGsBlkXd= 3            Ry    # [Xd] Response block size
% QpntsRXd
 1 |  1 |                   # [Xd] Transferred momenta
%
% EnRngeXd
 0.00000 | 20.00000 | eV    # [Xd] Energy range
%
% DmRngeXd
0.200000 | 0.200000 | eV    # [Xd] Damping range
%
ETStpsXd= 2001               # [Xd] Total Energy steps
% LongDrXd
1.000000 | 0.000000 | 0.000000 |        # [Xd] [cc] Electric Field
%
In this input file, we have the following:
- A q perpendicular to the sheet
- A wider energy range than before, and more broadening
- Selected the Hartree kernel, and expanding G-vectors up to 3 Ry (about 85 G-vectors)
Run the code
$ yambo -F yambo.in_RPA -V RL -J q100
and let's compare the absorption with and without the local fields included. By inspecting the 'o-q100.eps_q1_inv_rpa_dyson' file it's clear we need the 2nd and 4th columns, respectively:
# E/ev[1] EPS-Im[2] EPS-Re[3] EPSo-Im[4] EPSo-Re[5]
Plotting the result:
$ gnuplot
gnuplot > plot "o-q100.eps_q1_inv_rpa_dyson" u 1:2 t "q||x RPA-LFE" w l,"o-q100.eps_q1_inv_rpa_dyson" u 1:4 t "q||x noLFE" w l
It is clear that there is little influence of local fields in this case. We have also plotted the EELS spectrum for comparison.
Now let's switch to q perpendicular to the BN plane:
$ yambo -F yambo.in_RPA -V RL -J q001 -o c -k hartree        and set
...
% LongDrXd
0.000000 | 0.000000 | 1.000000 |        # [Xd] [cc] Electric Field
%
...
$ yambo -F yambo.in_RPA -V RL -J q001
Plotting the output file:
$ gnuplot
gnuplot> plot "o-q001.eps_q1_inv_rpa_dyson" u 1:2 t "RPA-LFE {/Symbol e}_2 q||z" w l,"o-q001.eps_q1_inv_rpa_dyson" u 1:4 t "noLFE {/Symbol e}_2 q||z" w l
In this case, the absorption is strongly blueshifted. Furthermore, the influence of local fields is striking, and quenches the spectrum strongly.
In order to understand this, we plot the electron energy loss spectrum for this component and compare with the absorption:
$ gnuplot
gnuplot > plot "o-q001.eps_q1_inv_rpa_dyson" u 1:2 t "q||z {/Symbol e}_2" w l,"o-q001.eel_q1_inv_rpa_dyson" u 1:2 t "q||z EELS" w l
The conclusion is that the dielectric function and EELS coincide for isolated systems, while this is not the case for periodic systems.
Summary
From this tutorial you've learned:
- How to compute a simple optical spectrum
- How to reduce the computational load through reducing the G-vector/energy cut off and removing the Vnl term
- How to plot different components of the dielectric tensor
- How to use the
-Joption to neatly label and organise files and databases


